
Page 22 - impiantistica_3_2015
P. 22
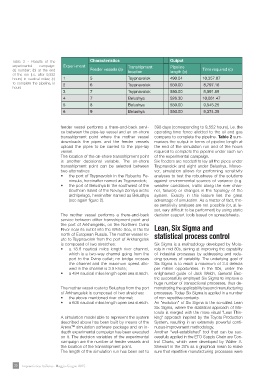
Table 2 - Results of the       Experi-ment      Characteristics     Transhipment     Output      Time required (c)
experimental campaign:                                              location         Pipeline
(a) number; (b) at the end     1                Feeder vessels (a)  Tsypnavolok      length (b)  10,357.07
of the run (i.e. after 9,552   2                                    Tsypnavolok      490.04      8,797.16
hours) in nautical miles; (c)  3                5                   Tsypnavolok      550.00      8,591.65
to complete the pipeline, in   4                6                   Belushya         550.00      10,061.47
hours                          5                7                   Belushya         526.30      9,545.25
                               6                7                   Belushya         550.00      9,374.39
                                                8                                    550.00
                                                9

                               feeder vessel performs a there-and-back servi-        398 days (corresponding to 9,552 hours), i.e. the
                               ce between the pipe-lay vessel and an on-shore        operating time fence allotted to the oil and gas
                               transshipment point where the mother vessel           company to complete the pipeline. Table 2 sum-
                               downloads the pipes and the feeder vessels            marizes the output in terms of pipeline length at
                               upload the pipes to be carried to the pipe-lay        the end of the simulation run and of the hours
                               vessel.                                               required to complete the pipeline under each run
                               The location of the on-shore transshipment point      of the experimental campaign.
                               is another decisional variable. The on-shore          Six feeders are needed to lay all the pipes under
                               transshipment point can be selected between           Tsypnavolok and eight under Belushya. Moreo-
                               two alternatives:                                     ver, simulation allows for performing sensitivity
                               •	 the port of Tsypnavolok in the Rybachy Pe-         analyses to test the robustness of the solutions
                                                                                     against environmental sources of variance (e.g.
                                     ninsula, hereinafter named as Tsypnavolok;      weather conditions, traffic along the river chan-
                               •	 the port of Belushya in the southwest of the       nel, failures) or changes in the topology of the
                                                                                     system. Exactly in this feature lies the great
                                     Southern Island of the Novaya Zemlya arctic     advantage of simulation. As a matter of fact, the-
                                     archipelago, hereinafter named as Belushya      se sensitivity analyses are not possible (or, at le-
                                     (see again figure 2).                           ast, very difficult to be performed) by using static
                                                                                     decision support tools based on spreadsheets.
                               The mother vessel performs a there-and-back
                               service between either transshipment point and        Lean, Six Sigma and
                               the port of Arkhangelsk, on the Northern Dvina        statistical process control
                               River near its outlet into the White Sea, in the far
                               north of European Russia. The mother vessel ro-       Six Sigma is a methodology developed by Moto-
                               ute to Tsypnavolok from the port of Arkhangelsk       rola in mid 80s, aiming at improving the capability
                               is composed of two stretches:                         of industrial processes by addressing and redu-
                               •	 a 18.6 nautical miles length river channel,        cing sources of variability. The underlying goal of
                                                                                     Six Sigma is to reach a maximum of 3.4 defects
                                     which is a two-way channel going from the       per million opportunities. In the 90s, under the
                                     port to the Dvina outlet; no bridge crosses     enlightened guide of Jack Welch, General Elec-
                                     the channel and the maximum speed allo-         tric successfully employed Six Sigma to improve a
                                     wed in the channel is 3.5 knots;                huge number of transactional processes, thus de-
                               •	 a 494 nautical miles length open sea stretch.      monstrating the applicability beyond manufacturing
                                                                                     processes. Today Six Sigma is applied in a number
                               The mother vessel route to Belushya from the port     of non-repetitive contexts.
                               of Arkhangelsk is composed of two stretches:          An “evolution” of Six Sigma is the so-called Lean
                               •	 the above-mentioned river channel;                 Six Sigma, where the statistical approach of Mo-
                               •	 a 605 nautical miles length open sea stretch.      torola is merged with the more visual “Lean Thin-
                                                                                     king” approach inspired by the Toyota Production
                               A simulation model able to represent the system       System, resulting in an extremely powerful conti-
                               described above has been built by means of the        nuous-improvement methodology.
                               ArenaTM simulation software package and an in-        Another “well-established” tool that can be suc-
                               depth experimental campaign has been executed         cessfully applied in the ETO Supply Chain are Con-
                               on it. The decision variables of the experimental     trol Charts, which were developed by Walter A.
                               campaign are the number of feeder vessels and         Shewart in the 20’s as a graphical mean to make
                               the location of the transshipment point.              sure that repetitive manufacturing processes were
                               The length of the simulation run has been set to

20 Impiantistica Italiana - Maggio-Giugno 2015