
Page 32 - 47
P. 32
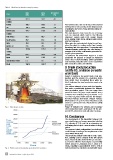
Table 2 – World steel production country by country

Area                   2014                          2013        2014/2013  The steel factories, that are the key of the industrial
                       (Mt)                          (Mt)            (%)    development of one country, are the largest source
Europe                 312.9                         313.2            -0.1  of pollutants due to the energy intensity during ste-
of which:                                                                   el production.
EU (28)                169.2                         166.3            1.7   The main impacts come from the use of energy
CIS                    105.3                         108.3            -2.8  and raw materials, which result in the following
North America          121.2                         118.9            2.0   emissions: carbon oxide (CO), carbon dioxide
of which:                                                                   (aCnOd2d),ussutlpehmuisr soioxindse.s (SOx), nitrogen oxides (NOx),
United States          88.3                          86.9             1.7   Water gets also contaminated during its use throu-
South America          45.2                          45.8             -1.4  ghout the plant for cooling and/or heat transfer,
Africa                 15.9                          16.1             -0.7  quenching and other processes. Cooperation with
Middle East            28.5                          26.5             7.7   chemical industry could help also steel factory to
Asia                   1132.3                        1116.1           1.4   manage at its best the solid wastes generated du-
of which:                                                                   ring the plant operations.
China                  822.7                         815.4            0.9   To overcome the environment impact of a steel
Japan                  110.7                         110.6            0.1   production we propose to design an Advanced
                       5.5                           5.6              -1.8  Green Steel Factory including power generation
Australia/New Zealand  1661.5                        1642.2           1.2   and chemical production and a cross cooperation
                                                                            with chemical factories and refineries.
World

                                                                            9. Crude steel production
                                                                            waniddeitbsaCsOis2 emission on world
                                                                            Figure 8 indicates the world crude steel pro-

                                                                            duction and      the   reAlastseodciaCtOio2n  emissions (Data
                                                                            from World      Steel                         files), while ta-

                                                                            ble 2 indicates the steel production country by

                                                                            country.

                                                                            The carbon intensity of iron and steel produc-

                                                                            tion varies considerably between the different

                                                                            steel production routes. This can range from

                                                                            a/ rEoluencdtric0.A4rtcoFnusrCnaOc2e/tso(nEsAcFrsu),detosateroeul nfodr  scrap
                                                                                                                                                     1.7 to

                                                                            1.8      tons   CFOur2n/taocnes  crude steel for the  integra-
                                                                            ted      Blast                   (BF) Basic Oxygen    Furnace

                                                                            (BOF) and to 2.4 up              toDi2re.5cttoRnesdCucOe2d/toIrnosn      crude
                                                                            steel for coal-based                                                      (DRI)

                                                                            processes.

Fig. 7 - Blast furnace section                                              Figure 9 indicates the primary and secondary

Fig. 8 - World crude steel production and related CO2 emissions             steel production routes and figure 10 the pro-
 30 Impiantistica Italiana - Luglio-Agosto 2016
                                                                            posed CO2 abatement and utilization strategy.

                                                                            10. Conclusions
                                                                            The development of this integration between refi-

                                                                            nery, steel factory and power generation including

                                                                            CtioOn2   utilization (CCU)      could be  an interesting op-
                                                                                     helping the set up      of a new  structure of energy

                                                                            sector.

                                                                            The proposed plant configurations here indicated

                                                                            could change according to the requirements of the

                                                                            areas where will be sited.

                                                                            This proposed synergy could help to coal’s salva-

                                                                            tion, enabling coal to compete in the low-carbon

                                                                            future. Recent studies state that the use of a varie-

                                                                            ty of carbon utilization technologies can potentially

                                                                            reduce   eaqnunautainl gCOto2    emissions from 3 Gtons to               4
                                                                            Gtons,                           approximately 10% to 12%                of

                                                                            current annual CO2 emissions on world wide basis.