
Page 92 - Impiantitica industriale
P. 92
MAIN APPLICATION
Experimental tests solids are accumulated in a tank for a period
and periodically discharged.
During experimental campaign, inlet flow rate was
modulated by regulation of by-pass valve while Development of the model
water flow ratio was regulated by a combination The experimental data achieved with the experi-
of overflow valve and underflow valve. Flow rates mental tests were used to develop a mathemati-
and pressures were monitored by means of flow cal model (by extrapolating constants values of the
indicators and pressure indicators. At the different models) that could be used to predict the desander
operative conditions, treated samples were studied performance and which was based on 4 general
in terms of particle size distribution and outlet sol- equations:
ids concentration. 1. Equation for calculation of flow rate in each
liner vs pressure drop across the hydrocyclone
The main variables considered during the experi- and temperature;
mental campaign are: 2. Equation for calculation of cut size (d50) vs
operative conditions (ΔP and Rw) in case of
VARIABLE RANGE open underflow.
INLET FLOW RATE, Q 8-9 m /h The flow ratio (Rw) is the ratio between un-
3
TEMPERATURE, T 25°C derflow and inlet flow rate. Typical values are
around 1%-3% in order to maximize water re-
PRESSURE DROP, ∆P 1-4 bar covery thus reducing concentrated water dis-
INLET SOLID CONCENTRATION, Cv 500 ppm charge. Lower values of Rw are not suggested
PARTICLE SIZE DISTRIBUTION 1-2000 µm, Mean value: 13.3 µm to avoid solids clogging.
3. Equation for calculation of cut size (d50) vs
SOLID DENSITY, ϱs 2.4 g/cm 3 operative conditions (ΔP) in case of closed/
potted underflow;
4. Equation for calculation of cut size separation
And these are the parameters whose behaviour efficiency vs pressure drop (ΔP).
has been modelled in the different operating condi-
tions: The equations used to develop the mathematical
model are taken from literature.
INVESTIGATED PARAMETERS The first part of the experimental plan allows to
calculate, once fixed the pressure drop across the
SEPARATION EFFICIENCY, η system, the number of liners required for the sepa-
ration.
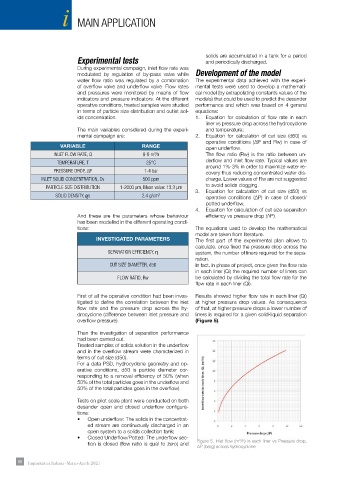
CUT SIZE DIAMETER, d50 In fact, in phase of project, once given the flow rate
in each liner (Qi) the required number of liners can
FLOW RATIO, Rw be calculated by dividing the total flow rate for the
flow rate in each liner (Qi).
First of all the operative condition had been inves- Results showed higher flow rate in each liner (Qi)
tigated to define the correlation between the inlet at higher pressure drop values. As consequence
flow rate and the pressure drop across the hy- of that, at higher pressure drops a lower number of
drocyclone (difference between inlet pressure and liners is required for a given solid-liquid separation
overflow pressure). (Figure 5).
Then the investigation of separation performance
had been carried out.
Treated samples of solids solution in the underflow
and in the overflow stream were characterized in
terms of cut size (d50).
For a data PSD, hydrocyclone geometry and op-
erative conditions, d50 is particle diameter cor-
responding to a removal efficiency of 50% (when
50% of the total particles goes in the underflow and
50% of the total particles goes in the overflow).
Tests on pilot scale plant were conducted on both
desander open and closed underflow configura-
tions:
• Open underflow: The solids in the concentrat-
ed stream are continuously discharged in an
open system to a solids collection tank;
• Closed Underflow/Potted: The underflow sec- 3
tion is closed (flow ratio is qual to zero) and Figure 5. Inlet flow (m /h) in each liner vs Pressure drop,
ΔP (barg) across hydrocyclone
86 Impiantistica Italiana - Marzo-Aprile 2021