
Page 28 - Impiantistica Industriale
P. 28
a. We have built a complexity index that Our research has shown that from 2009 to
measures the evolution of the O&G 2016 market complexity, as defined by the
market level of complexity from 2009 eight variables above, has doubled, going
to 2016 and highlights the key com- from 1,0 (2009-2012 period) to 2,0 (2014-
plexity factors 2016 period). Four main elements have driven
Three years of low oil prices, together with the complexity increase. Those are in order
pre-existing dynamics, have given rise to of relevance: access to financing, contracts
a new equilibrium. What are its key cha- complexity and client’s rigidity on contractual
racteristics? Has complexity increased or terms and conditions, technological leaps and
diminished? How does it affect contrac- local content requirements.
tors and component manufacturers?
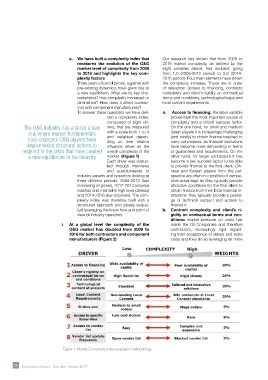
To answer these questions we have defi- a. Access to financing: the latter variable
ned a complexity index, proves itself the most important source of
composed of eight dri- complexity and a critical success factor.
The O&G industry has entered a new vers, that are measured On the one hand, for small and medium
era, where market fundamentals with a scale from 1 to 4 Italian players it is increasingly challenging
have changed: O&G players have and weighted depen- (and costly) to obtain finance required to
ding on their relative
carry out projects, as financial institutions
implemented structural actions to influence driver on the have become more demanding in terms
respond to the crisis that have created overall complexity of the of guarantees and requirements. On the
a new equilibrium in the industry market. (Figure 1) other hand, for larger contractors it has
Each driver was evalua- become a key success factor to be able
ted through interviews to provide finance to the final client. Chi-
and questionnaires to nese and Korean players from this per-
industry experts and operators looking at spective are often in a position of compe-
three different periods: 2009-2012 (fast titive advantage as they typically provide
increasing oil prices), 2012-2014 (oil price attractive conditions for the final client to
reaches and maintains high level plateau) obtain finance from their local financial in-
and 2014-2016 (low oil prices). The com- stitutions: they typically provide a packa-
plexity index was therefore built with a ge of technical support and access to
structured approach and closely evalua- finance it.
ted leveraging the know how and point of b. Contract complexity and client’s ri-
view of industry operators. gidity on contractual terms and con-
ditions: market pressure on costs has
3. At a global level the complexity of the made the Oil Companies and therefore
O&G market has doubled from 2009 to contractors, increasingly rigid regard-
2016 for both contractors and component ing their acceptance of delays and extra
manufacturers (Figure 2) costs and they do so leveraging on more
Figure 1. Market Complexity Index evaluation methodology
26 Impiantistica Italiana - Settembre-Ottobre 2017