
Page 53 - Impiantistica Italiana
P. 53
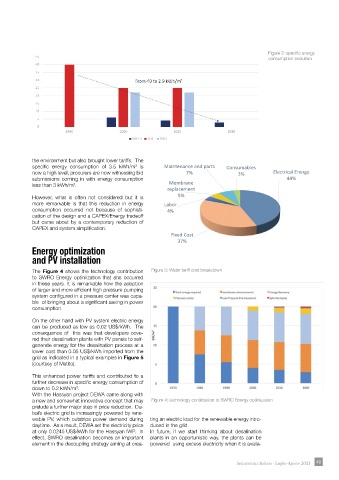
Figure 2: specifi c energy
                                                                                               consumption evolution


            the environment but also brought lower tariffs.  The
            specifi c energy consumption of 3.5 kWh/m  is   Maintenance and parts  Consumables
                                                 3
            now a high level, procurers are now witnessing bid    7%                 3%          Electrical Energy
            submissions  coming  in  with energy  consumption                                         44%
            less than 3 kWh/m .                             Membrane
                           3
                                                            replacement
            However, what is often not considered but it is     5%
            more remarkable is that this reduction in energy   Labor
            consumption occurred not because of sophisti-   4%
            cation of the design and a CAPEX/Energy tradeoff
            but came about by a contemporary reduction of
            CAPEX and system simplifi cation.
                                                             Fixed Cost
                                                               37%
            Energy optimization
            and PV installation

            The Figure 4 shows the technology contribution   Figure 3: Water tariff cost breakdown
            to SWRO Energy optimization that ahs occurred
            in these years. It is remarkable how the adoption
            of larger and more effi cient high pressure pumping
            system confi gured in a pressure center was capa-
            ble  of bringing about a signifi cant saving in power
            consumption.

            On the other hand with PV system electric energy
            can be produced as low as 0.02 US$/kWh.  The
            consequence of  this was that developers cove-
            red their desalination plants with PV panels to self-
            generate energy for the desalination process at a
            lower cost than 0.05 US$/kWh imported from the
            grid as indicated in a typical examples in Figure 5
            (courtesy of Metito).

            This enhanced power tariffs and contributed to a
            further decrease in specifi c energy consumption of
            down to 0.2 kWh/m .
                            3
            With the Hassyan project DEWA came along with
            a new and somewhat innovative concept that may   Figure 4: technology contribution to SWRO Energy optimization
            prelude a further major step in price reduction.  Du-
            bai’s electric grid is increasingly powered by rene-
            wable PV, which outstrips power demand during   ting an electric load for the renewable energy intro-
            daytime.  As a result, DEWA set the electricity price   duced in the grid.
            at only 0.0245 US$/kWh for the Hassyan IWP.  In   In future, if we start thinking about desalination
            effect, SWRO desalination becomes an important   plants in an opportunistic way, the plants can be
            element in the decoupling strategy aiming at crea-  powered  using excess electricity when it is availa-


                                                                                    Impiantistica Italiana - Luglio-Agosto 2021  49 49