Page 72 - Impiantistica industriale Luglio Agosto 20147
P. 72
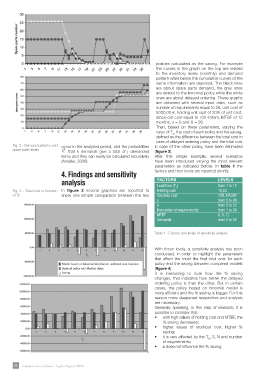
policies calculated as the saving. For example
the curves in the graph on the top are related
to the inventory levels (monthly) and demand
pattern while below the cumulative curves of the
same information are depicted. The black lines
are about spare parts demand, the grey ones
are related to the binomial policy while the white
ones are about delayed ordering. These graphs
are obtained with several input data, such as
number of requirements equal to 26, unit cost of
5000,00 €, holding unit cost of 20% of unit cost,
stock-out cost equal to 700 €/item, MTBF of 12
months, s = 0 and S = 26.
Then, based on these parameters, varying the
value of T , the cost of each policy and the saving,
S
defned as the difference between the total cost in
case of delayed ordering policy and the total cost
Fig. 2 - Demand patterns and occur in the analyzed period, and the probabilities in case of the other policy, have been estimated
spare parts levels that k demands give a total of j demanded (fgure 3).
items and they can easily be calculated recursively After this simple example, several scenarios
(Axsäter, 2006). have been introduced varying the most relevant
parameters as indicated before. In table 1 the
4. Findings and sensitivity factors and their levels are reported shortly.
analysis FActorS LeveLS
Lead time (T )
from 1 to 12
Fig. 3 - Total cost in function In fgure 2 several graphics are reported to Holding cost S 16,83
of Ts show one simple comparison between the two Stockout cost 700, 10.000
s from 0 to 26
S from 2 to 52
N (number of requirements) from 1 to 26
MTBF 6, 9, 12
Demands from 2 to 52
Table 1 - Factors and levels of sensitivity analysis
With these levels, a sensitivity analysis has been
conducted, in order to highlight the parameters
that affect the most the fnal total cost for each
policy and the saving between compared models
(fgure 4).
It is interesting to note how the % saving
changes, that indicates how better the delayed
ordering policy is than the other. But in certain
cases, the policy based on binomial model is
more effcient and the % saving is bigger. For this
reason more deepened researches and analysis
are necessary.
Generally speaking, in this step of research, it is
possible to consider that:
• with high values of holding cost and MTBF, the
% saving decreases;
• higher values of stockout cost, higher %
saving;
• it is very affected by the T , S, N and number
S
of requirements;
• s does not infuence the % saving.
68 Impiantistica Italiana - Luglio-Agosto 2014