
Page 49 - Impiantistica Novembre-Dicemvre 2015
P. 49
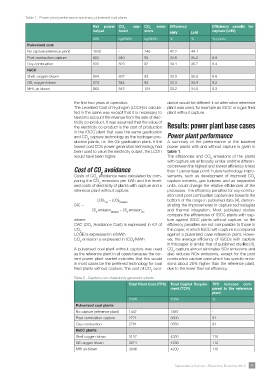
Table 1 - Power plant performance summary, pulverised coal plants
Net power CtuOre2d cap- CsiOon2 s emis- Efficiency LHV Efficiency penalty for
output kg/MWh kg/MWh HHV % capture (LHV)
% % points
MW
8.9
Pulverised coal 1030 - 746 42.2 44.1 8.4
No capture (reference plant)
Post combustion capture 822 840 93 33.6 35.2 8.6
Oxy-combustion 9.2
IGCC 833 823 92 34.1 35.7 9.3
Shell, oxygen-blown
GE, oxygen-blown 804 837 93 33.9 35.5
MHI, air-blown
874 844 94 33.3 34.9
863 842 104 33.2 34.8
the first two years of operation. dance would be different if an alternative reference
The Levelised Cost of Hydrogen (LCOH) is calcula- plant was used, for example an IGCC or a gas fired
ted in the same way except that it is necessary to plant without capture.
take into account the revenue from the sale of elec-
tricity co-product. It was assumed that the value of Results: power plant base cases
the electricity co-product is the cost of production
in the IGCC plant that uses the same gasification Power plant performance
danudctiCoOn 2pclaanpttsu,rie.et.etchhenoGloEggyaassificthaetiohnydprloagnet.nIfptrhoe- A summary of the performance of the baseline
lowest cost CCS power generation technology had
been used to value the electricity output, the LCOH power plants with and without capture is given in
would have been higher.
table 1.
The efficiencies aanll dbroCaOd2lyesmimisilsaior nasndotfhtehedifpfelarennts-
with capture are
Cost of CO avoidancepCseaodrsintcsgoosthtfseCoOCf O2ela2e2vceotmridicisaitsnyicooenfspwlpaeenrertskcwWalicthhualcanatedpdttuhbreey ce between the highest and lowest efficiency is less
than 1 percentage point. Future technology impro-
com- vements, such as development of imairprsoevpeadraCtioOn2
leveli- capture solvents, gas turbines and
and a
units, could change the relative efficiencies of the
reference plant without capture: processes. The efficiency penalties for oxy-combu-
stion and post combustion capture are towards the
----------L-C--O-E--cc-s-–---L-C-O--E-r-e-fe-re-n-c-e ----------------- bottom of the range in published data [4], demon-
CAC
= strating the improvements in capture technologies
CO2 emissionreference – CO2 emissionccs and thermal integration. Most published studies
compare the efficiencies of IGCC plants with cap-
where: ture against IGCC plants without capture, so the
LCCCAOOC2 E(CisOe2xpArveosidseadncine Cost) is expressed in €/t of efficiency penalties are not comparable to those in
€/MWh
this paper, in which IGCC with capture is compared
against a pulverised case reference plant. Howe-
CO2 emission is expressed in tCO2/MWh ver, the average efficiency of IGCCs with capture
in this paper is similar that of published studies [4].
A pulverised coal plant without capture was used aClsOo2 capture almost eliminates SOx emissions and
as the reference plant in all cases because the cur- reduces NOx emissions, except for the post
rent power plant market indicates that this would
in most cases be the preferred technology for coal combustion capture case which has specific emis-
fired plants without capture. The cost of CO2 avoi-
sions about 25% higher than the reference plant,
due to the lower thermal efficiency.
Table 2 - Capital costs of electricity generation plants Total Capital Require- TPC increase com-
Total Plant Cost (TPC) ment (TCR) pared to the reference
plant
Pulverised coal plants €/kW €/kW %
No capture (reference plant)
Post combustion capture 1447 1887 -
Oxy-combustion 2771 3600 91
IGCC plants 2761 3583 91
Shell oxygen-blown
GE oxygen-blown 3157 4350 118
MHI air-blown 3074 4238 112
3046 4200 110
Impiantistica Italiana - Novembre-Dicembre 2015 47