
Page 51 - Impiantistica Novembre-Dicemvre 2015
P. 51
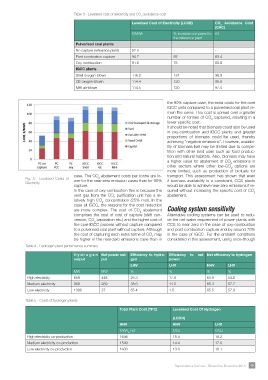
Table 3 - Levelised cost of electricity and CO2 avoidance cost
Levelised Cost of Electricity (LCOE) C(COA2C)Avoidance Cost
€/t
€/MWh % increase compared to
the reference plant
Pulverised coal plants 52.0 - -
No capture (reference plant) 94.7 82 65.4
Post combustion capture 91.6 76 60.8
Oxy-combustion
IGCC plants 116.5 124 98.9
Shell oxygen-blown 114.4 120 95.8
GE oxygen-blown 114.5 120 97.4
MHI air-blown
the 90% capture case, the extra costs for the core
IGCC units compared to a pulverised coal plant re-
main the same. This cost is spread over a greater
number of tonnes of CO2 captured, resulting in a
lower specific cost.
It should be noted that biomass could also be used
in oxy-combustion and IGCC plants and greater
proportions of biomass could be used, thereby
achieving “negative emissions”. However, availabi-
lity of biomass fuel may be limited due to compe-
tition with other land uses such as food produc-
tion and natural habitats. Also, biomass may have
a higher value swfuohcr eharbeaastoetpmhreoerdnutlocowtfio-CCnOOo22f emissions in
other sectors options are
more limited, biofuels for
Fig. 3 - Levelised Costs of wcaesref.oTr htheeCnOea2 ra-zbeartoememenistscioonstcsaspeesr tonne are lo- transport. This assessment has shown that even
Electricity than for 90%
if biomass availability is a constraint, CCS plants
capture. would be able to achieve near-zero emissions if re-
In the case of oxy-combustion this is because the quired without increasing the specific cost of CO2
abatement.
lcvaeatnisvetelgyoafhsIiGgfrhCoCmC,Otth2heecoCrenOacse2onpntursaritffiioocrnatti(ho2en5%cuonsmitt ohrela).dsuInacttirohene-
Cooling system sensitivity
are more complex. The cost ocfapCtOur2e abatement
comprises the cost of cost of (shift con- Alternative cooling systems can be used to redu-
ce the net water requirement of power plants with
tvheerscioonre, CIGOC2 Cseppraorcaetiossn etc.) and the higher cost of CCS to near zero in the case of oxy-combustion
without capture compared and post combustion capture and by around 70%
in the case of IGCC. For the ambient conditions
to a pulverised coal plant without capture. Although considered in this assessment, using once-though
the cost of capturing each eexmtriasstioonnnsecoafsCe Oth2amn ainy
be higher in the near-zero
Table 4 - Hydrogen plant performance summary
H y d r o g e n Net power out- Efficiency to hydro- Efficiency to net Net efficiency to hydrogen
output put gen power
LHV LHV HHV LHV
MW MW % % %%
High electricity 659 448 26.3 17.8 60.9 53.8
Medium electricity
Low electricity 969 289 38.6 11.5 65.3 57.7
1390 37 55.4 1.5 65.5 57.9
Table 5 - Costs of hydrogen plants Total Plant Cost (TPC) Levelised Cost Of Hydrogen
High electricity co-production HHV (LCOH) LHV
Medium electricity co-production €/kWH net HHV €/GJ
Low electricity co-production 1646 €/GJ 18.2
1549 15.4 17.0
1430 14.4 16.1
13.6
Impiantistica Italiana - Novembre-Dicembre 2015 49