
Page 50 - Impiantistica Novembre-Dicemvre 2015
P. 50
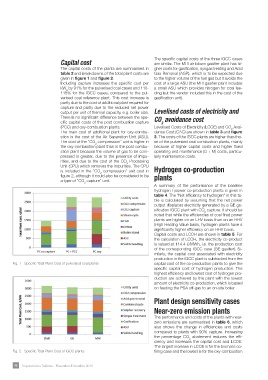
Capital cost                                                                                              The specific capital costs of the three IGCC cases
The capital costs of the plants are summarised in                                                         are similar. The MHI air blown gasifier plant has hi-
                                                                                                          gher costs for gasification, syngas treating and Acid
table 2 and breakdowns of the total plant costs are                                                       Gas Removal (AGR), which is to be expected due
                                                                                                          to the higher volume of the fuel gas but it avoids the
given in figure 1 and figure 2.                                                                           cost of a large ASU (the MHI gasifier plant includes
                                                                                                          a small ASU which provides nitrogen for coal fee-
Including capture increases the specific cost per                                                         ding but the vendor included this in the cost of the
                                                                                                          gasification unit).
1kW18e%byfo9r1%thefoIrGthCeCpuclavseeriss,edcocmoaplacreadsetsoatnhde1p1u0l--

verised coal reference plant. This cost increase is

partly due to the cost of additional plant required for

capture and partly due to the reduced net power                                                           Levelised costs of electricity and

output per unit of thermal capacity, e.g. boiler size.

There is no significant difference between the spe-                                                       CO2 avoidance cost

cific capital costs of the post combustion capture

(PCC) and oxy-combustion plants.                                                                          Levelised Costs of  aErleecsthriocwityn(LinCtOaEb)lean3daCndO2fiAgvuorei-
                                                                                                          dance Cost (CAC)
The main cost of additional plant for oxy-combu-

stion is the cost of the Air Separation Unit (ASU).                                                       3. The costs of the IGCC plants are higher than tho-

The  ocxoys-tcoofmthbeus“tCioOn2pclaonmtpthreasnsiionnt”huenpitoisst  higher in                           se of the pulverised coal combustion plants, mainly
the                                                                   combu-
                                                                                                          because of higher capital costs and higher fixed

stion plant because the volume of gas to be com-                                                          operating and maintenance (O + M) costs, particu-

pressed is greater, due to the presence of impu-                                                          larly maintenance costs.

rities, and  due to the cost of                               timhepuCrOitie2 sP.rTohceesCsPinUg          Hydrogen co-production
Unit (CPU)   which removes the                                                                            plants

is included in the                                 it“CcoOu2ldcoamlsoprbeesscioonn”siduenritedcotostbine
figure 2, although

a type of “CO2 capture” unit.                                                                             A summary of the performance of the baseline

                                                                                                          hydrogen / power co-production plants is given in

                                                                                                          table 4. The “Net efficiency to hydrogen” in this ta-

                                                                                                          ble is calculated by assuming that the net power

                                                                                                          output displaces electricity generated by a GE ga-

                                                                                                          sification IGCC plant  ewffiitchieCnOci2ecsaopftcuorea.l  It should be
                                                                                                          noted that while the                                      fired power

                                                                                                          plants are higher on an LHV basis than on an HHV

                                                                                                          (High Heating Value basis, hydrogen plants have a

                                                                                                          significantly higher efficiency on an HHV basis.

                                                                                                          Capital costs and LCOH are shown in table 5. For

                                                                                                          the calculation of LCOH, the electricity co-product

                                                                                                          is valued at 114.4 €/MWh, i.e. the production cost

                                                                                                          of the corresponding IGCC case (GE gasifier). Si-

                                                                                                          milarly, the capital cost associated with electricity

                                                                                                          production in the IGCC plant is subtracted from the

Fig. 1 - Specific Total Plant Cost of pulverised coal plants                                              capital cost of the co-production plants to give the

                                                                                                          specific capital cost of hydrogen production. The

                                                                                                          highest efficiency and lowest cost of hydrogen pro-

                                                                                                          duction are achieved by the plant with the lowest

                                                                                                          amount of electricity co-production, which is based

                                                                                                          on feeding the PSA off-gas to an on-site boiler.

                                                                                                          Plant design sensitivity cases

                                                                                                          Near-zero emission plants
                                                                                                          The performance and costs of the plants with near-

                                                                                                          zero emissions are summarised in table 6, which

                                                                                                          also shows the change in efficiencies and costs

                                                                                                          compared to plants with 90% capture. Increasing

                                                                                                          tchieencpyeracnedntaingcereCasOe2s  abatement    reduces the effi-
                                                                                                                                              the capital  cost and LCOE.

                                                                                                          The largest increase in LCOE is for the biomass co-

Fig. 2 - Specific Total Plant Cost of IGCC plants                                                         firing case and the lowest is for the oxy-combustion

48 Impiantistica Italiana - Novembre-Dicembre 2015