
Page 57 - 83
P. 57
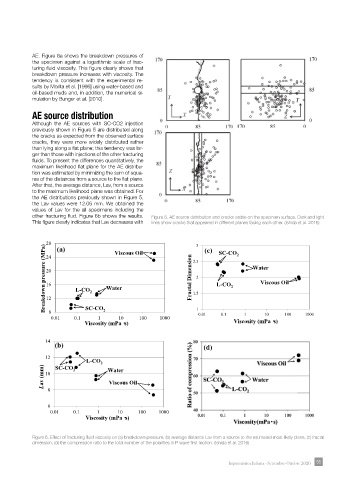
AE. Figure 6a shows the breakdown pressures of
            the specimen against a logarithmic scale of frac-

            turing fl uid viscosity. This fi gure clearly shows that
            breakdown pressure increases with viscosity. The

            tendency is consistent with the experimental re-
            sults by Morita et al. [1996] using water-based and

            oil-based muds and, in addition, the numerical si-
            mulation by Bunger et al. [2010].


            AE source distribution
            Although the AE sources with SC-CO2 injection

            previously shown in Figure 5 are distributed along

            the cracks as expected from the observed surface
            cracks, they were more widely distributed rather

            than lying along a fl at plane; this tendency was lar-
            ger than those with injections of the other fracturing

            fl uids. To present the differences quantitatively, the
            maximum likelihood fl at plane for the AE distribu-

            tion was estimated by minimizing the sum of squa-
            res of the distances from a source to the fl at plane.

            After that, the average distance, Lav, from a source
            to the maximum likelihood plane was obtained. For

            the AE distributions previously shown in Figure 5,
            the Lav values were 12.06 mm. We obtained the

            values of Lav for the all specimens including the
            other fracturing fl ud. Figure 6b shows the results.

            This fi gure clearly indicates that Lav decreases with   Figure 5. AE source distribution and cracks visible on the specimen surface. Dark and light

                                                      lines show cracks that appeared in different planes facing each other. (Ishida et al. 2016)

                 28
                    (a)            Figure 5                           3
                                                                         (c)
                (MPa)                    Viscous Oil                          SC-CO
                 (MPa) 24
                 28                                                                 2
                     (a)                                             2.5 3  (c)
                 20                      Viscous Oil                          SC-CO 2     Water
                 24
                                                                     2.5
                 Breakdown pressure
                                                                    Fractal Dimension  2  Water
                                                                                             Viscous Oil
                 20
                Breakdown pressure  16  L-CO  Water                          L-CO 2
                                2                                   Fractal Dimension  2
                                                                     1.5                    Viscous Oil
                 16
                 12                   Water                                  L-CO 2
                            L-CO 2                                   1.5
                              SC-CO
                 8
                 12                  2                                1
                                                                       0.01    0.1     1      10     100    1000
                  0.01    0.1      1      10     100    1000                       Viscosity (mPa・s)

                               SC-CO
                  8           Viscosity (mPa・s)                       1
                                     2

                   0.01    0.1     1       10     100    1000          0.01    0.1     1      10     100    1000
                                                                                   Viscosity (mPa・s)
                               Viscosity (mPa・s)


                 14
                    (b)                                                  (d)

                  14
                 12  (b)       L-CO 2                                   (d)
                Lav (mm)  10  SC-CO 2 2  L-CO 2  Water
                  12
                                       Viscous Oil
                     SC-CO
                 Lav (mm)  10           Viscous Oil
                                        Water
                  8
                  6 8
                   0.01    0.1     1      10      100    1000
                               Viscosity (mPa・s)
                   6
                   0.01    0.1      1      10     100    1000
                                Viscosity (mPa・s)


            Figure 6. Effect of fracturing fl uid viscosity on (a) breakdown pressure, (b) average distance Lav from a source to the estimated most likely plane, (c) fractal

               dimension, (d) the compression ratio to the total number of the polarities in P wave fi rst motion. (Ishida et al. 2016)
                                                            Figure 6


                                                            Figure 6
                                                                 3               Impiantistica Italiana - Settembre-Ottobre 2020  55 55

                                                                                                                   4
                                                                  3                                                                     2
                                                                                                                   4