Page 56 - 83
P. 56

ENGINEERING


                                                                      L-CO  (Liquid CO ), water and viscous oil, besides
                                                                                   2
                                                                          2
                                                                      SC-CO . The all fracturing fl uids were injected un-
                                                                           2
                                                                      der the same fl ow rate of 10 mL/min into the cen-
                                                                      tral interval of 60 mm length of the hole, sealed by
                      Z                                               a straddle packer with O-rings in the both ends.
                                                                      Experimental results
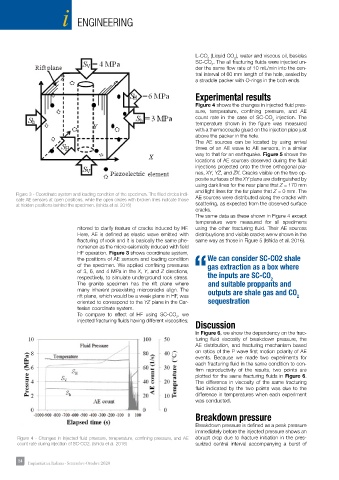
                                                                      Figure 4 shows the changes in injected fl uid pres-
                                                                      sure, temperature, confi ning pressure, and AE
                                                                      count rate in the case of SC-CO  injection. The
                                                                                                 2
                                                                      temperature shown in the fi gure was measured
                                  Y                                   with a thermocouple glued on the injection pipe just
                                                                      above the packer in the hole.
                                                                      The AE sources can be located by using arrival
                                                                      times of an AE wave to AE sensors, in a similar
                                                                      way to that for an earthquake. Figure 5 shows the
                                                     X
                                                                      locations of AE sources observed during the fl uid
                                                                      injections projected onto the three orthogonal pla-
                                                                      nes, XY, YZ, and ZX. Cracks visible on the two op-
                                                                      posite surfaces of the XY plane are distinguished by
                                                                      using dark lines for the near plane that Z = 170 mm

 Figure 3      Figure 3 - Coordinate system and loading condition of the specimen. The fi lled circles indi-  and light lines for the far plane that Z = 0 mm. The
                                                                      AE sources were distributed along the cracks with
       cate AE sensors at open positions, while the open circles with broken lines indicate those
        at hidden positions behind the specimen. (Ishida et al. 2016)  scattering, as expected from the observed surface
                                                                      cracks.
                              Z                                       The same data as these shown in Figure 4 except
                                                                      temperature were measured for all specimens
                            nitored to clarify feature of cracks induced by HF.   using the other fracturing fl uid. Their AE sources
                            Here, AE is defi ned as elastic wave emitted with   distribuytions and visible cracks werw shown in the
                            fracturing of rock and it is basically the same phe-  same way as those in Figure 5 (Ishida et al. 2016).
                            nomenon as the micro-seismicity induced with fi eld
                            HF operation. Figure 3 shows coordinate system,
                                       Y
                            the positions of AE sensors and loading condition   We can consider SC-CO2 shale
                            of the specimen. We applied confi ning pressures
                                                                          gas extraction as a box where
                            of 3, 6, and 4 MPa in the X, Y, and Z directions,
                            respectively, to simulate underground rock stress. “the inputs are SC-CO
                                                       X
                                                                                                2

                            The  granite  specimen  has  the rift  plane  where   and suitable proppants and
                            many inherent preexisting microcracks align. The   outputs are shale gas and CO
                            rift plane, which would be a weak plane in HF, was                           2

    Figure 3                oriented to correspond to the YZ plane in the Car-  sequestration
                            tesian coordinate system.
                            To compare to effect of HF using SC-CO , we
                                                               2
                            injected fracturing fl uids having different viscosities;   Discussion

                                                                      In Figure 6, we show the dependency on the frac-
                                                                      turing fl uid viscosity of breakdown pressure, the
                                                                      AE distribution, and fracturing mechanism based
                                                                      on ratios of the P wave fi rst motion polarity of AE
                                                                      events. Because we made two experiments for
                                                                      each fracturing fl uid in the same condition to con-
 Figure 4                                                             fi rm reproductivity of the results, two points are

                                                                      plotted for the same fracturing fl uids in Figure 6.
                                                                      The  difference  in viscosity  of  the same  fracturing
                                                                      fl uid indicated by the two points was due to the
                                                                      difference in temperatures when each experiment
                                                                      was conducted.

                                                                 1

                                                                      Breakdown pressure

                                                                      Breakdown pressure is defi ned as a peak pressure
                                                                      immediately before the injected pressure shows an
       Figure 4 - Changes in injected fl uid pressure, temperature, confi ning pressure, and AE   abrupt drop due to fracture initiation in the pres-

       count rate during injection of SC-CO2. (Ishida et al. 2016)    surized  central  interval  accompanying  a  burst  of
     Figure 4

       54 54  Impiantistica Italiana - Settembre-Ottobre 2020


                                                                1
   51   52   53   54   55   56   57   58   59   60   61