
Page 44 - Impiantistica Italiana 5/2016
P. 44
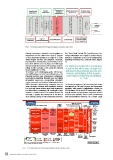
Fig. 1 - IOCS (International Oil Companies) initiatives along the value chain

through headcount reduction and suppliers re- Eni, Total, Shell, Statoil, BP, Saudi Aramco, So-

negotiation on the other hand. Such a respon- nangol, Woodside and Engie) to assess the po-

se has generated savings in a range of 5÷15%, tential to standardize a first set of components,

which helped but was not sufficient. Therefore, including Christmas trees and ball valves (figure

the industry is moving into a second wave of ac- 1).

tions that will be more strategic and will target
both productivity increase and business restruc- The industry is moving into a second wave
turing. In this scenario, costs could be reduced                                          of actions that will be more strategic and
by an additional 15÷25%.                                                                  will target both productivity increase and
To achieve such challenging goals, Oil Compa-                                             business restructuring. In this scenario,
nies will leverage on both internal levers (e.g. eli-                                     costs could be reduced by an additional
minating portfolio and organization complexity;                                                                                                                                           15÷25%.

increasing productivity through lean and digital

production processes; accelerating standardi-

zation process) and external interventions (e.g.

M&A; business restructuring; energetic mix re- For the above reasons, the turmoil has had a rele-

view; strategic relations with suppliers). Indeed, vant impact on Oil Field Services and Equipment

if a year ago some actions were only arguments providers with market capitalization shrunk by

for discussions, nowadays Oil Companies have 25% between 2014 and 2015 and impacts affec-

started to move forward. On standardization for ting all service and equipment segments in both

Lae2x0ap1m5rpealmev,oiasngipoarongjereoctudpwioasfsOkpiilcCekeosdmapoaffgnaieltosth(bCehaeenlvderoonO,f FoaSnndsEhuoènrecoarnnivdbenoatfifossnhsaoliresp,rtoaajnedcitnsin. bIqnoutaharcesocinevtneutnsttitotuindayl
i segmenti, per effetto di ulteriori 'greenfield projects' rinviati

   Total spend in                                                                                                                                                                                     Total spend in
2014: $US 986bn                                                                                                                                                                                    2016: $US 656bn

CAGR (’14 – ’16F)                                   1 to 10%    No growth    Comparison
     >10%                                           -6 to -10%  -11 to -25%  unavailable

     0 to -5%                                                                >-25%

Note: Data calculated from consolidated E&P expenditures excl. internal spend                                                                                                             PROVISIONAL
Source: Rystad, May 2016, Bain Analysis

   This information is confidential and was prepared by Bain & Company solely for the use of our client; it is not to be relied on by any 3rd party without Bain's prior written consent

Fig. 2 - IOCS (International Oil Companies) initiatives along the value chain

42 Impiantistica Italiana - Settembre-Ottobre 2016