
Page 98 - Impiantistica industriale
P. 98
TECHNOLOGICAL APPLICATION
The load considered are:
• Standard earth gravity;
• Live load;
• Live Load (LL), the live load applied to the fl oor
of the enclosure is equal to 3 kN/m^2;
• The blast load for each face.
The FEM fi nal results are:
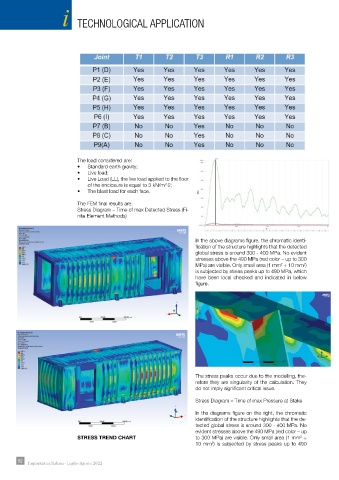
Stress Diagram – Time of max Detected Stress (Fi-
nite Element Methods)
In the above diagrams fi gure, the chromatic identi-
fi cation of the structure highlights that the detected
global stress is around 300 - 400 MPa. No evident
stresses above the 490 MPa (red color – up to 300
MPa) are visible. Only small area (1 mm ÷ 10 mm )
2
2
is subjected by stress peaks up to 490 MPa, which
have been local checked and indicated in below
fi gure.
The stress peaks occur due to the modelling, the-
refore they are singularity of the calculation. They
do not imply signifi cant critical issue.
Stress Diagram – Time of max Pressure at Stake
In the diagrams fi gure on the right, the chromatic
identifi cation of the structure highlights that the de-
tected global stress is around 300 - 400 MPa. No
evident stresses above the 490 MPa (red color – up
2
STRESS TREND cHART to 300 MPa) are visible. Only small area (1 mm ÷
10 mm ) is subjected by stress peaks up to 490
2
92 92 Impiantistica Italiana - Luglio-Agosto 2022