
Page 99 - Impiantistica industriale
P. 99
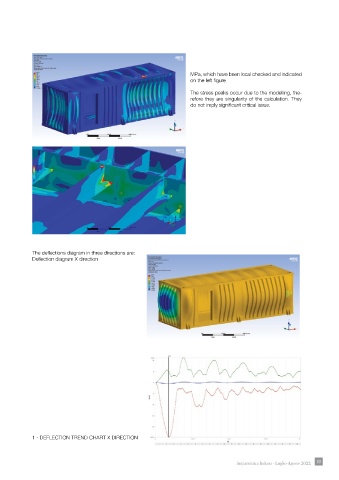
MPa, which have been local checked and indicated
                                                                    on the left fi gure

                                                                    The stress peaks occur due to the modelling, the-
                                                                    refore they are singularity of the calculation. They
                                                                    do not imply signifi cant critical issue.


            The defl ections diagram in three directions are:
            Defl ection diagram X direction


            1 - DEFLECTION TREND CHART X DIRECTION


                                                                                    Impiantistica Italiana - Luglio-Agosto 2022  93