
Page 95 - impiantistica_3_2015
P. 95
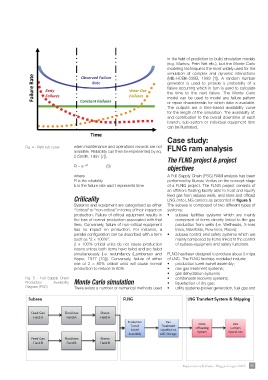
in the field of prediction to build simulation models
                                                                                        (e.g. Markov, Petri Net etc.), but the Monte Carlo
                                                                                        modeling technique is the most widely used for the
                                                                                        simulation of complex and dynamic interactions
                                                                                        (MIL-HDBK-338B, 1998 [1]). A random number
                                                                                        generator is used to provide a probability of a
                                                                                        failure occurring which in turn is used to calculate
                                                                                        the time to the next failure. The Monte Carlo
                                                                                        model can be used to model any failure pattern
                                                                                        or repair characteristic for which data is available.
                                                                                        The outputs are a time-based availability curve
                                                                                        for the length of the simulation. The availability of,
                                                                                        and contribution to the overall downtime of each
                                                                                        branch, sub-system or individual equipment item
                                                                                        can be illustrated.

Fig. 4 - Bath tub curve      when maintenance and operations records are not            Case study:
                             available. Reliability can then be represented by eq.      FLNG ram analysis
                             2 (Smith, 1997 [7]).
                                                                                        The FLNG project & project
                             R = e –λt		  (3)                                           objectives

                             where                                                      A Full Supply Chain (FSC) RAM analysis has been
                             R is the reliability                                       performed by Bureau Veritas on the concept stage
                             λ is the failure rate and t represents time                of a FLNG project. The FLNG project consists of
                                                                                        an offshore floating facility able to treat and liquefy
                             Criticality                                                feed gas from subsea wells, and store and offload
                                                                                        LNG onto LNG carriers as presented in figure 5.
                             Systems and equipment are categorised as either            The subsea is composed of two different types of
                             ‘”critical” or “non-critical” in terms of their impact on  systems:
                             production. Failure of critical equipment results in       •	 subsea facilities systems which are mainly
                             the loss of normal production associated with that
                             item. Conversely, failure of non-critical equipment              composed of items directly linked to the gas
                             has no impact on production. For instance, a                     production from wells (i.e. Wellheads, X-mas
                             parallel configuration can be described with a term              trees, Manifolds, Flow lines, Risers);
                             such as “2 × 100%”.                                        •	 subsea control and safety systems which are
                             2 × 100% critical units do not cause production                  mainly composed by items linked to the control
                             losses unless both items have failed and are failed              of subsea equipment and safety functions.
                             simultaneously (i.e. redundancy (Lamberson and
                             Kapur, 1977 [10])). Conversely, failure of either          FLNG has been designed to produce about 3 mtpa
                             one of 2 × 80% critical units will cause normal            of LNG. The FLNG facilities modelled include:
                             production to reduce to 80%.                               •	 production turret swivel assembly;
                                                                                        •	 raw gas treatment systems;
Fig. 5 - Full Supply Chain   Monte Carlo simulation                                     •	 gas dehydration systems;
                                                                                        •	 condensate recovery systems;
Production     Availability  There exists a number of numerical methods used            •	 liquefaction of dry gas;
                                                                                        •	 utility systems (power generation, fuel gas and
Diagram (PAD)

                                                                                        Impiantistica Italiana - Maggio-Giugno 2015 93