
Page 100 - impiantistica_3_2015
P. 100
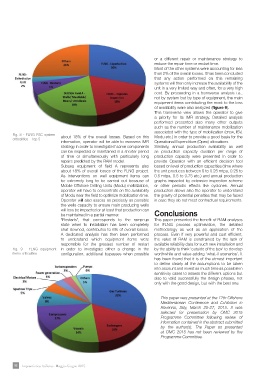
Fig. 8 - FLNG FSC system  about 18% of the overall losses. Based on this         or a different repair or maintenance strategy to
criticalities – Top 5     information, operator will be able to reassess IMR     reduce the repair time or restart time.
                          strategy in order to investigate if some components    Most of the other systems were accounting for less
Fig. 9 - FLNG equipment   can be inspected or maintained in a shorter period     than 2% of the overall losses. It has been concluded
items criticalities       of time or simultaneously with particularly long       that any action performed on this remaining
                          repairs predicted by the RAM model.                    systems will then only increase the availability of the
                          Subsea equipment of field A represents also            unit in a very limited way and often, for a very high
                          about 18% of overall losses of the FLNG project.       cost. By proceeding in a transverse analysis i.e.,
                          As interventions on well equipment items can           not by system but by type of equipment, the main
                          be extremely long to be carried out because of         equipment items contributing the most to the loss
                          Mobile Offshore Drilling Units (Modu) mobilization,    of availability were also analyzed (figure 9).
                          operator will have to concentrate on the availability  This transverse view allows the operator to give
                          of Modu near the field to optimize mobilization time.  a priority for its IMR strategy. Detailed analysis
                          Operator will also assess as precisely as possible     performed presented also many other outputs
                          the wells capacity to ensure main producing wells      such as the number of maintenance mobilization
                          will less be impacted or at least that production can  associated with the type of mobilization (crew, ISV,
                          be maintained in a partial manner.                     Modu etc.) in order to provide a good basis for the
                          “Restarts”, that corresponds to the ramp-up            Operational Expenditure (Opex) allocations.
                          state when to installation has been completely         Similarly, annual production availability as well
                          shut downed, contributes to 6% of overall losses.      as production capacity duration per range of
                          A dedicated analysis has then been performed           production capacity were presented in order to
                          to understand which equipment items were               provide Operator with an efficient decision tool
                          responsible for the greatest number of restart         based on level of production capacities (time where
                          in order to investigate either a change in the         the unit produces between 0 to 0.25 mtpa, 0.25 to
                          configuration, additional bypasses when possible       0.5 mtpa, 0.5 to 0.75 etc.) and annual production
                                                                                 graphs impacted by extensive inspection scheme
                                                                                 or other periodic effects like cyclones. Annual
                                                                                 production allows also the operator to understand
                                                                                 the gravity of potential penalties that may be faced
                                                                                 in case they do not meet contractual requirements.

                                                                                 Conclusions

                                                                                 This paper presented the benefit of RAM analyses
                                                                                 for FLNG process optimisation, the detailed
                                                                                 methodology as well as an application of the
                                                                                 process. Even if very powerful and cost efficient,
                                                                                 the value of RAM is constrained by the lack of
                                                                                 available reliability data for such new installation and
                                                                                 by the ability to think ‘outside of the box’ to develop
                                                                                 worthwhile and value adding ‘what-if scenarios’. It
                                                                                 has been found that it is of the utmost important
                                                                                 to define clearly all the assumptions to be taken
                                                                                 into account and invest as much time as possible in
                                                                                 sensitivity cases to assess the different options but
                                                                                 also to valid successfully the design phases, not
                                                                                 only with the good design, but with the best one.

                                                                                 This paper was presented at the 12th Offshore
                                                                                 Mediterranean Conference and Exhibition in
                                                                                 Ravenna, Italy, March 25-27, 2015. It was
                                                                                 selected for presentation by OMC 2015
                                                                                 Programme Committee following review of
                                                                                 information contained in the abstract submitted
                                                                                 by the author(s). The Paper as presented
                                                                                 at OMC 2015 has not been reviewed by the
                                                                                 Programme Committee.

98 Impiantistica Italiana - Maggio-Giugno 2015