
Page 29 - 60
P. 29
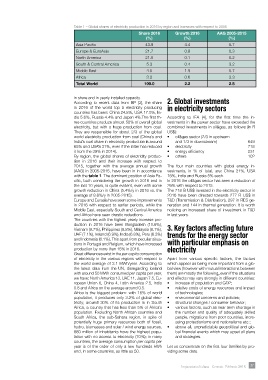
Table 1 – Global shares of electricity production in 2016 by region and increases with respect to 2005
                                                               Share 2016      Growth 2016       AAG 2005-2015
                                                                  (%)              (%)                 (%)
                                   Asia Pacific                   43.9             4.4                 5.7
                                   Europe & EuroAsia              21.7             0.8                 0.3
                                   North America                  21.5             0.1                 0.2
                                   South & Central America        5.3              0.4                 3.2
                                   Middle East                    4.5              1.9                 5.7
                                   Africa                         3.2              0.6                 3.3
                                   Total World                   100.0             2.2                 2.8


                                  in share and in yearly installed capacity.
                                  According to  recent data from BP  [3], the share  2. Global investments
                                  in 2016 of the world top 5 electricity producing   in electricity sectors
                                  countries has been: China 24.8%, USA 17.5%, In-
                                  dia 5.6%, Russia 4.4% and Japan 4%.The first th-  According to IEA [4], for the first time the in-
                                  ree countries produce almost 50% of overall global   vestments in the power sector have exceeded the
                                  electricity, but  with  a  huge production  from coal.   combined investments in oil&gas, as follows (in B
                                  They are responsible for about 2/3 of the global   US$):
                                  world electricity production from coal (China’s and   •   oil&gas sector (2/3 in upstream
                                  India’s coal share in electricity production is around   and 1/3 in downstream)   649
                                  65% and USA’s 31%, even if the latter has reduced   •   electricity          718
                                  it from the 39% in 2014).                •   energy efficiency               231
                                  By region, the global shares of electricity produc-  •   others              102
                                  tion in 2016 and their increase with respect to
                                  2015, together with the average annual  growth   The four main countries with global energy in-
                                  (AAG) in 2005-2015, have been in in accordance   vestments, in % of total, are: China 21%, USA
                                  with the table 1. The dominant position of Asia Pa-  16%, India and Russia 5% each.
                                  cific, both considering the growth in 2016 and in   In 2016 the oil&gas sector has seen a reduction of
                                  the last 10 years, is quite evident, even with some   26% with respect to 2015.
                                  growth reduction in China (5.4%/y in 2016 vs. the   The 718 B US$ invested in the electricity sector in
                                  average of 8.8%/y in 2005-2015).         2016 have been directed towards 277 B US$ in
                                  Europe and Eurasia have seen some improvements   T&D (Transmission & Distribution), 297 in RES ge-
                                  in 2016 with respect to earlier periods, while the   neration and 144 in thermal generation. It is worth
                                  Middle East, especially South and Central America   noticing an increased share of investment in T&D
                                  and Africa have seen drastic reductions.  in last years.
                                  The countries with the highest yearly increase pro-
                                  duction in 2016 have been Bangladesh (10.6%),
                                  Vietnam (9.7%), Philippines (8.8%), Malaysia (8.1%),  3. Key factors affecting future
                                  UAE (7.1%), Ireland (6.9%), India (6.8%), Peru (6.3%)   trends for the energy sector
                                  and Indonesia (6.1%). This apart from peculiar situa-
                                  tions in Portugal and Belgium, which have increased  with particular emphasis on
                                  production by more than 15% in 2016.     electricity
                                  Great differences exist in the per capita consumption
                                  of electricity in the various regions with respect to   Apart from various specific factors, the factors
                                  the world average of 3.1 MWh/year. According to   which appear as being more important from a glo-
                                  the latest data from the UN, disregarding Iceland   bal view (however with mutual interactions between
                                  with around 50 MWh consumed per capita per year,   them) are mostly the following, even if the situations
                                  we have: North America 13, UAE 11, Japan 7.5, Eu-  and effects may vary strongly in different countries:
                                  ropean Union 6, China 4, Latin America 2.5, India   •   increase of population and GDP;
                                  0.8 and Africa on the average around 0.5.  •   relative costs of energy resources and impact
                                  Africa is the biggest problem: with 16% of world   of technologies;
                                  population, it produces only 3.2% of global elec-  •   environmental concerns and policies;
                                  tricity; around 30% of its production is in South   •   structural changes / consumer behavior;
                                  Africa, a country that has less than 5% of Africa’s   •   various factors, such as near term shortage in
                                  population. Excluding North African countries and   the number and quality of adequately skilled
                                  South Africa, the sub-Sahara region, in spite of   people, migrations from poor countries, incre-
                                  potentially  huge  primary  resources  both  of  fossil,   asing protectionisms and nationalisms etc.;
                                  hydro, biomasses and solar / wind energy sources,   •   above all, unpredictable geopolitical and glo-
                                  880 million of inhabitants have the highest popu-  bal financial events which may upset all plans
                                  lation with no access to electricity (70%); in many   and strategies.
                                  countries, the average consumption per capita per
                                  year is of the order of only a few hundreds kWh   Let us concentrate on the first four families by pro-
                                  and, in some countries, as little as 50.  viding some data.


                                                                                 Impiantistica Italiana - Gennaio- Febbraio 2018  27