
Page 33 - 60
P. 33
response, intelligent homes, smart grids;
• interconnections between countries.
IEA underlines that “overall, the grid is modernizing
and moving away from a pure electricity delivery bu-
siness to an integrated platform for data and servi-
ces, enabled by rapid progress in digital information
and communications technologies, which grew to
over 10% of networks spending”. This is changing
the roles of all the stakeholders completely.
4. Summary and conclusions
There will be no shortage of fossil fuels for very
many decades; there will be however socio-poli-
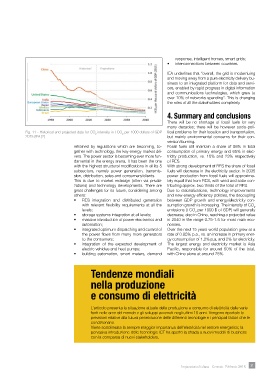
Fig. 11 - Historical and projected data for CO intensity in t CO per 1000 dollars of GDP tical problems for their location and transportation,
2
2
2015 (IEA [2] but mainly environmental concerns for their con-
version/burning.
refrained by regulations which are becoming, to- Fossil fuels still maintain a share of 86% in total
gether with technology, the key energy market dri- consumption of primary energy and 65% in elec-
vers. The power sector is becoming ever more fun- tricity production, vs. 10% and 23% respectively
damental in the energy arena. It has been the one of RES.
with the highest structural modifications in all its 5 With strong development of RES the share of fossil
subsectors, namely power generation, transmis- fuels will decrease in the electricity sector. In 2035
sion, distribution, sales and consumers/clients. power production from fossil fuels will approxima-
This is due to market redesign (often via privati- tely equal that from RES, with wind and solar con-
zations) and technology developments. There are tributing approx. two thirds of the total of RES.
great challenges for its future, considering among Due to rationalizations, technology improvements
others: and new energy efficiency policies, the decoupling
• RES integration and distributed generation between GDP growth and energy/electricity con-
with relevant flexibility requirements at all the sumption growth is increasing. The intensity of CO
2
levels; emissions (t CO per 1000 $ of GDP) will generally
2
• storage systems integration at all levels; decrease, also in China, reaching a projected value
• massive introduction of power electronics and in 2040 in the range 0.75-1.5 for most main eco-
automation; nomies.
• integrated optimum dispatching and control of Over the next 15 years world population grew at a
the power flows from many more generators rate of 0.85% p.a., vs. an increase in primary ener-
to the consumers; gy consumption of 1.2% p.a. and 2% for electricity.
• integration of the expected development of The largest energy and electricity market is Asia
electric vehicles and heat pumps; Pacific, responsible for around 50% of the total,
• building automation, smart meters, demand with China alone at around 25%.
Tendenze mondiali
nella produzione
e consumo di elettricità
L’articolo presenta la situazione attuale della produzione e consumo di elettricità dalle varie
fonti nelle aree del mondo e gli sviluppi avvenuti negli ultimi 15 anni. Vengono riportate le
previsioni relative alla futura penetrazione delle differenti tecnologie e i principali fattori che le
condizionano.
Viene sottolineata la sempre maggior importanza dell’elettricità nel settore energetico; la
pervasiva introduzione delle tecnologie ICT ha aperto la strada a nuovi modelli di business
con la comparsa di nuovi stakeholders.
Impiantistica Italiana - Gennaio- Febbraio 2018 31