
Page 30 - 60
P. 30
more than 50% of total world population growth by
2050, according to UN (5), reaching 26% of world
population, or 2.5 billion people. The median age
in 2016 in Africa was 19.5 years (in some countries
down to 15-16), compared to a world average of
30 years (40 years and above for USA, Canada,
Japan and the majority of EU countries); only in
2050 the median age of African population is ex-
pected to reach 25 years.
About 58% of the global GDP in 2016 originated
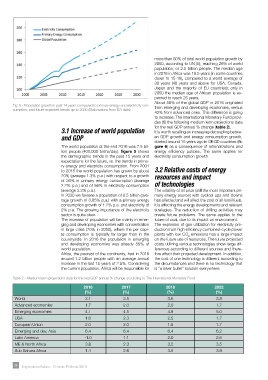
Fig. 5 - Population growth in past 14 years compared to primary energy and electricity con- from emerging and developing economies, versus
sumption, and future expected trends up to 2030 (Elaborations from IEA data)
42% from advanced ones. This difference is going
to increase. The International Monetary Fund provi-
des (6) the following medium term projections data
3.1 Increase of world population for the real GDP annual % change (table 2).
It is worth recalling an increasing decoupling betwe-
and GDP en GDP growth and energy consumption growth,
started around 15 years ago in OECD countries (fi-
The world population at the end 2016 was 7.5 bil- gure 6) as a consequence of rationalizations and
lion people (400,000 births/day). figure 5 shows energy efficiency policies. The same applies for
the demographic trends in the past 15 years and electricity consumption growth.
expectations for the future, vs. the trends in prima-
ry energy and electricity consumption. From 2001
to 2015 the world population has grown by about 3.2 Relative costs of energy
20% (average 1.3% p.a.) with respect to a growth resources and impact
of 36% in primary energy consumption (average
2.2% p.a.) and of 56% in electricity consumption of technologies
(average 3.2% p.a.). The volatility of oil price (still the most important pri-
In 2030 we foresee a population of 8.5 billion (ave- mary energy source) with cyclical ups and downs
rage growth of 0.85% p.a.) with a primary energy has affected and will affect the cost of all fossil fuels.
consumption growth of 1.2% p.a. and electricity of It is affecting the energy developments and relevant
2% p.a. The growing importance of the electricity strategies. The reduction of drilling activities may
sector is quite clear. create future problems. The same applies to the
The increase of population will be mainly in emer- future of coal, due to its impact on environment.
ging and developing economies with concentration The explosion of gas utilization for electricity pro-
in large cities (70% in 2050), where the per capi- duction from high efficiency combined-cycle power
ta consumption is typically far larger than in the plants with low CO emissions has a large impact
2
countryside. In 2016 the population in emerging on the future use of resources. The future projected
and developing economies was already 85% of costs utilizing various technologies show large dif-
world population. ferences according to different sources and there-
Africa, the poorest of the continents, had in 2016 fore affect their projected development. In addition,
around 1.2 billion people with an average annual the cost of one technology is different according to
increase in the last 15 years of 2.5%. Considering the circumstances and there is no technology that
the current population, Africa will be responsible for is “a silver bullet” solution everywhere.
Table 2 – Medium term projections data for the real GDP annual % change according to The International Monetary Fund
2016 2017 2018 2022
(%) (%) (%) (%)
World 3.1 3.5 3.6 3.8
Advanced economies 1.7 2.0 2.0 1.7
Emerging economies 4.1 4.5 4.9 5.0
USA 1.6 2.3 2.5 1.7
European Union 2.0 2.0 1.8 1.7
Emerging and dev. Asia 6.4 6.4 6.4 6.2
Latin America -1.0 1.1 2.0 2.6
ME & North Africa 3.8 2.3 3.2 3.5
Sub Sahara Africa 1.4 2.6 3.5 3.9
28 Impiantistica Italiana - Gennaio- Febbraio 2018