
Page 31 - 60
P. 31
technologies is usually performed on the basis of
LCOE (Levelized Cost of Energy) analyses. The Le-
velized Cost of a particular generation technology
is the ratio of the total costs of a generic plant (in-
cluding both capital and operating costs) to the to-
tal amount of electricity expected to be generated
over the plant’s lifetime. Both are expressed in net
present value terms, affected by depreciation rates.
After due consideration of numerous variables and
Fig. 6 - Decoupling in OECD of primary energy consumption from GDP development (IEA hypotheses involved (capital costs and their tren-
WEO 2016); the same applies for electricity consumption growth ds, primary resources costs and local availability /
variability for RES, local manpower costs, load fac-
tors, CO emission costs, depreciation rates etc.)
2
the results from different sources show high spre-
ads at global level for each resource. Therefore,
local analyses must be performed. As an example,
the results in GBP/MWh of a recent analysis in the
UK [7] are reported in figure 8.
Data on LCOE units to be placed in service in
2019-2022 and 2040 in the US may be found in
[8]. Other useful data can be found in [9].
Looking into the future, Bloomberg estimates that
the world electricity production will grow from
around 25,000 TWh in 2016 to 32,500 in 2030 and
around 38,000 TWh in 2040 (+ 52% in 24 years),
with the reported share of primary energy sources
as in figure 9.
The development of intermittent RES (wind and so-
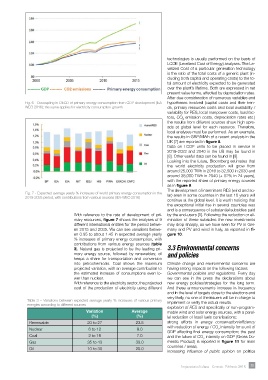
Fig. 7 - Expected average yearly % increases of world primary energy consumption in the lar) seen in some countries in the last 10 years will
2015-2035 period, with contributions from various sources (IEA-WEO 2016)
continue at the global level. It is worth noticing that
the exceptional initial rise in several countries was
and is a consequence of substantial subsidies paid
With reference to the rate of development of pri- by the end-users [1]. Following the reduction or eli-
mary resources, figure 7 shows the analyses of 9 mination of these subsidies the new investments
different international entities for the period betwe- may drop sharply, as we have seen for PV in Ger-
en 2015 and 2035. We can see variations betwe- many and PV and wind in Italy, as reported in fi-
en 0.95 to about 1.45 in expected average yearly gure 10.
% increases of primary energy consumption, with
contributions from various energy sources (table
3). Natural gas is projected to be the leading pri- 3.3 Environmental concerns
mary energy source, followed by renewables; oil and policies
keeps a share for transportation and conversion
into petrochemicals. Coal shows the maximum Climate change and environmental concerns are
projected variation, with an average contribution to having strong impacts on the following factors:
the estimated increase of consumptions even lo- Governmental policies and regulations. Every day
wer than nuclear. we can see in the press the declarations about
With reference to the electricity sector, the projected new energy policies/strategies for the long term.
cost of the production of electricity using different And these announcements increase in frequency
and in the level of targets close to the elections and
very likely, no one of the issuers will be in charge to
Table 3 – Variations between expected average yearly % increases of various primary implement or verify the actual results.
energies according to different sources
explosion of RES and specifically of non-program-
Variation Average mable wind and solar energy sources, with a paral-
(%) (%) lel reduction of fossil fuels contributions;
Renewable 20 to 27 23.5 strong efforts in energy conservation/efficiency
with reduction of energy / CO intensity for a unit of
Nuclear 6 to 12 9.0 2
GDP affecting final energy consumption; the past
Coal 2 to 16 7.0 and the future of CO intensity on GDP (Gross Do-
2
Gas 35 to 43 39.0 mestic Product) is reported in figure 11 for main
countries / areas;
Oil 10 to 30 20.0
increasing influence of public opinion on politics
Impiantistica Italiana - Gennaio- Febbraio 2018 29