
Page 57 - 74
P. 57
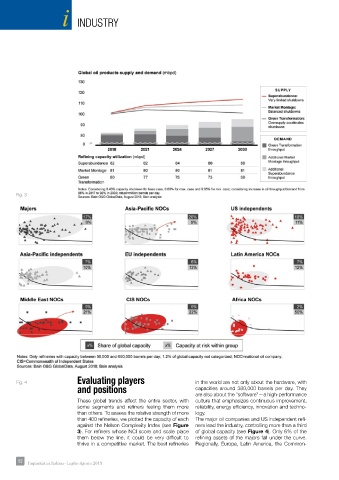
industry


       Fig. 3


                            Evaluating players
       Fig. 4                                                         in the world are not only about the hardware, with
                            and positions                             capacities  around  380,000  barrels  per  day.  They
                                                                      are also about the “software”—a high-performance
                            These global trends affect the entire sector, with   culture that emphasizes continuous improvement,
                            some segments and refi ners feeling them more   reliability, energy effi ciency, innovation and techno-
                            than others. To assess the relative strength of more   logy.
                            than 400 refi neries, we plotted the capacity of each   The major oil companies and US independent refi -
                            against the Nelson Complexity Index (see Figure   ners lead the industry, controlling more than a third
                            3). For refi ners whose NCI score and scale place   of global capacity (see Figure 4). Only 6% of the
                            them below the line, it could be very diffi cult to   refi ning assets of the majors fall under the curve.
                            thrive in a competitive market. The best refi neries   Regionally, Europe, Latin America, the Common-


       52 52  Impiantistica Italiana - Luglio-Agosto 2019