
Page 88 - Impiantistica industriale
P. 88
SUSTAINABLE SOLUTIONS
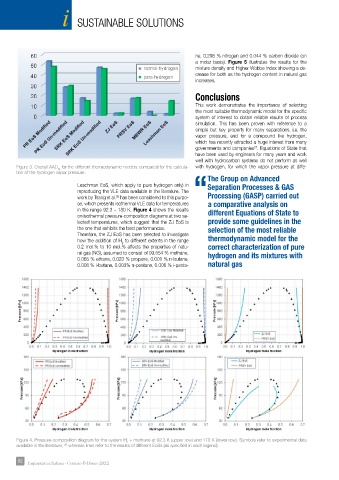
ne, 0.296 % nitrogen and 0.044 % carbon dioxide (on
a molar basis). Figure 5 illustrates the results for the
mixture density and Higher Wobbe Index showing a de-
crease for both as the hydrogen content in natural gas
increases.
Conclusions
This work demonstrates the importance of selecting
the most suitable thermodynamic model for the specific
system of interest to obtain reliable results of process
simulation. This has been proven with reference to a
simple but key property for many separations, i.e. the
vapor pressure, and for a compound like hydrogen,
which has recently attracted a huge interest from many
governments and companies . Equations of State that
27
have been used by engineers for many years and work
well with hydrocarbon systems do not perform as well
Figure 3. Overall AAD for the different thermodynamic models compared for the calcula- with hydrogen, for which the vapor pressure at diffe-
%
tion of the hydrogen vapor pressure.
The Group on Advanced
Leachman EoS, which apply to pure hydrogen only) in Separation Processes & GAS
reproducing the VLE data available in the literature. The
work by Tsang et al. has been considered to this purpo- “Processing (GASP) carried out
26
se, which presents isothermal VLE data for temperatures a comparative analysis on
in the range 92.3 – 180 K. Figure 4 shows the results different Equations of State to
on isothermal pressure-composition diagrams at two se-
lected temperatures, which suggest that the ZJ EoS is provide some guidelines in the
the one that exhibits the best performances. selection of the most reliable
Therefore, the ZJ EoS has been selected to investigate
how the addition of H to different extents in the range thermodynamic model for the
2
0.2 mol.% to 10 mol.% affects the properties of natu- correct characterization of pure
ral gas (NG), assumed to consist of 99.554 % methane, hydrogen and its mixtures with
0.065 % ethane, 0.023 % propane, 0.001 % n-butane,
0.008 % i-butane, 0.003% n-pentane, 0.006 % i-penta- natural gas
Figure 4. Pressure-composition diagram for the system H + methane at 92.3 K (upper row) and 170 K (lower row). Symbols refer to experimental data
2
available in the literature, whereas lines refer to the results of different EoSs (as specified in each legend).
26
82 82 Impiantistica Italiana - Gennaio-Febbraio 2022