
Page 87 - Impiantistica industriale
P. 87
Historic Building of the
Politecnico di Milano
The MBWR EoS is a 32-term EoS applicable only to vapor pressure for both forms of hydrogen, whereas the
24
a specific set of pure components (e.g., argon, metha- Un-modified PR EoS, the Un-modified SRK EoS and
ne, ethylene, hydrogen) and in a specific range of ope- the PRSV EoS underestimate it. The models that show
rating conditions (for hydrogen, 14 to 400 K and up to the best performances are the ZJ EoS, the MBWR EoS
120 MPa). It is particularly recommended for hydrogen and the Leachman EoS. The AAD calculated on all the
%
liquefaction. experimental data available for each form of hydrogen
The EoSs developed by Leachman et al. for the different is shown in Figure 3. By looking at it, it is possible to
1
forms of hydrogen are explicit in the Helmotz free energy observe that the lowest deviations of the calculated
and are reported to be valid from the triple-point tempe- vapor pressure from the experimental values are obtai-
ratures to 1000 K and for pressures up to 2000 MPa. ned with the ZJ EoS, the MBWR EoS, and the EoS by
The performances of the considered models have been Leachman et al., which exhibit AAD values of 2.4 %,
1
%
compared by computing the percent Average Absolute 0.1 % and 14.5 %, respectively, for p-H and of 2.3 %,
2
Deviation (AAD ): 3.9 % and 1.7 %, respectively, for n-H .
% 2
Considering the proposals of injecting H in the natural
2
gas network, it is also interesting to deal with the sy-
stem H + natural gas. Various studies have shown that
2
most parts of the natural gas system can cope well with
hydrogen addition of up to 10 %, with no adverse effects.
where n refers to the number of data points and P and In this work, the mixture H + methane has been consi-
2
exp
P , respectively, denote the experimental and calcula- dered first, assuming that natural gas consists of pure
calc
ted values of the vapor pressure. methane. This binary system is of Type III according to
the classification of Van Konynenburg and Scott, which
25
Results means that the critical curve is not a continuous line that
extends from the critical point of one component to the
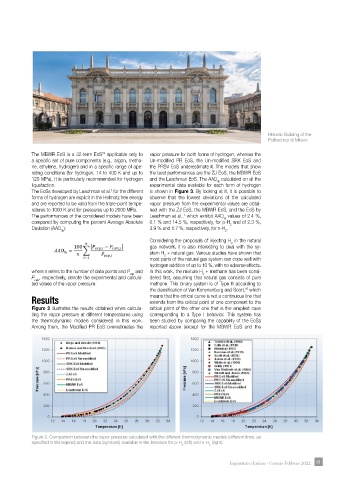
Figure 2 illustrates the results obtained when calcula- critical point of the other one that is the simplest case
ting the vapor pressure at different temperatures using corresponding to a Type I behavior. This system has
the thermodynamic models considered in this work. been studied by comparing the capability of the EoSs
Among them, the Modified PR EoS overestimates the reported above (except for the MBWR EoS and the
Figure 2. Comparison between the vapor pressure calculated with the different thermodynamic models (different lines, as
specified in the legend) and the data (symbols) available in the literature for p-H (left) and n-H (right).
2 2
Impiantistica Italiana - Gennaio-Febbraio 2022 81 81